Note
Go to the end to download the full example code.
Custom Relationships#
This example demonstrates how to define many-to-many relationships between
agents using the @relationship decorator. Relationships are essential
for modeling network effects, supply chains, and multi-agent interactions.
You’ll learn to:
Understand relationship concepts and COO sparse format
Define relationships with the
@relationshipdecoratorStore edge-specific data (amount, rate, duration)
Query and aggregate relationship data
Add and remove edges (connections)
What are Relationships?#
In BAM Engine’s ECS architecture:
Roles hold agent state (like Producer, Worker)
Relationships connect agents from different roles
Relationships store edge data for each connection
For example, the built-in LoanBook connects Borrowers (firms) to
Lenders (banks), with each loan having principal, rate, and debt.
import numpy as np

import bamengine as bam
from bamengine import Bool, Float, Int, get_role, ops, relationship

# Check the built-in LoanBook relationship
sim = bam.Simulation.init(n_firms=50, n_households=250, n_banks=5, seed=42)
loans = sim.get_relationship("LoanBook")

print("Built-in LoanBook relationship:")
print(f"  Type: {type(loans).__name__}")
print("  Source role: Borrower (firms)")
print("  Target role: Lender (banks)")
print(f"  Cardinality: {loans.cardinality}")
print(f"  Current edges: {loans.size}")
print(f"  Capacity: {loans.capacity}")
Built-in LoanBook relationship:
  Type: LoanBook
  Source role: Borrower (firms)
  Target role: Lender (banks)
  Cardinality: many-to-many
  Current edges: 0
  Capacity: 128
COO Sparse Format#
Relationships use COO (Coordinate List) sparse format:
source_ids: Array of source agent IDstarget_ids: Array of target agent IDsEdge data arrays (e.g.,
principal,rate)Only first
sizeentries are valid
This is memory-efficient: O(active_edges) vs O(n_source × n_target).
# Run a few periods to create some loans
sim.run(n_periods=10)

print("\nAfter 10 periods:")
print(f"  Active loans: {loans.size}")

if loans.size > 0:
    # View first few loans
    n_show = min(5, loans.size)
    print(f"\n  First {n_show} loans:")
    print(f"    Borrower IDs: {loans.source_ids[:n_show]}")
    print(f"    Lender IDs:   {loans.target_ids[:n_show]}")
    print(f"    Principal:    {loans.principal[:n_show].round(2)}")
    print(f"    Rate:         {loans.rate[:n_show].round(4)}")
After 10 periods:
  Active loans: 0
Defining a Custom Relationship#
Use @relationship decorator to define new relationships.
You must specify source and target roles.
@relationship(
    source=get_role("Worker"),
    target=get_role("Employer"),
    cardinality="many-to-many",
)
class EmploymentHistory:
    """Historical employment records.

    Tracks all past and current employment relationships with
    detailed job-level data.
    """

    # Job details (Float)
    wage: Float  # Wage paid in this job
    start_wage: Float  # Starting wage when hired
    performance_score: Float  # Performance rating (0-100)

    # Duration tracking (Int)
    start_period: Int  # When employment started
    duration: Int  # Periods worked so far

    # Status (Bool)
    is_active: Bool  # Currently employed here
    was_fired: Bool  # Terminated by employer


print("\nEmploymentHistory relationship created!")
print("  Source: Worker")
print("  Target: Employer")
print(f"  Registered as: {EmploymentHistory.name}")
EmploymentHistory relationship created!
  Source: Worker
  Target: Employer
  Registered as: EmploymentHistory
Supply Chain Relationship Example#
A more complex example modeling firm-to-firm supply relationships.
@relationship(
    source=get_role("Producer"),  # Buyer (source)
    target=get_role("Producer"),  # Seller (target) - same role!
    cardinality="many-to-many",
    name="SupplyChain",
)
class SupplyChainNetwork:
    """Supply chain relationships between firms.

    Models input-output relationships where firms buy
    intermediate goods from other firms.
    """

    # Trade details
    contract_value: Float  # Annual contract value
    unit_price: Float  # Price per unit
    quantity: Float  # Units per period

    # Relationship metrics
    reliability_score: Float  # Supplier reliability (0-1)
    relationship_age: Int  # Periods in relationship

    # Status
    is_primary: Bool  # Primary supplier flag


print("\nSupplyChainNetwork relationship created!")
print("  Source: Producer (buyer)")
print("  Target: Producer (seller)")
print("  Note: Same role can be both source and target")
SupplyChainNetwork relationship created!
  Source: Producer (buyer)
  Target: Producer (seller)
  Note: Same role can be both source and target
Instantiating and Populating Relationships#
Relationships are typically created with pre-allocated capacity.
# Create employment history with capacity for 100 records
n_records = 100

employment = EmploymentHistory(
    # COO format base arrays
    source_ids=np.full(n_records, -1, dtype=np.intp),
    target_ids=np.full(n_records, -1, dtype=np.intp),
    size=0,  # No active edges yet
    capacity=n_records,
    # Edge data arrays
    wage=np.zeros(n_records, dtype=np.float64),
    start_wage=np.zeros(n_records, dtype=np.float64),
    performance_score=np.zeros(n_records, dtype=np.float64),
    start_period=np.zeros(n_records, dtype=np.int64),
    duration=np.zeros(n_records, dtype=np.int64),
    is_active=np.zeros(n_records, dtype=np.bool_),
    was_fired=np.zeros(n_records, dtype=np.bool_),
)

print("\nEmployment history instantiated:")
print(f"  Size: {employment.size}")
print(f"  Capacity: {employment.capacity}")
Employment history instantiated:
  Size: 0
  Capacity: 100
Adding Edges Manually#
Add edges by setting array values and incrementing size.
# Add some employment records
def add_employment_record(emp, worker_id, employer_id, wage, start_period):
    """Helper to add a single employment record."""
    idx = emp.size
    if idx >= emp.capacity:
        raise ValueError("Relationship at capacity")

    emp.source_ids[idx] = worker_id
    emp.target_ids[idx] = employer_id
    emp.wage[idx] = wage
    emp.start_wage[idx] = wage
    emp.performance_score[idx] = 75.0  # Default score
    emp.start_period[idx] = start_period
    emp.duration[idx] = 0
    emp.is_active[idx] = True
    emp.was_fired[idx] = False
    emp.size += 1


# Add some records
add_employment_record(employment, worker_id=0, employer_id=2, wage=50.0, start_period=1)
add_employment_record(employment, worker_id=1, employer_id=2, wage=55.0, start_period=1)
add_employment_record(employment, worker_id=2, employer_id=0, wage=60.0, start_period=3)
add_employment_record(employment, worker_id=3, employer_id=1, wage=45.0, start_period=2)
add_employment_record(
    employment, worker_id=0, employer_id=1, wage=52.0, start_period=5
)  # Job change!

print("\nAfter adding records:")
print(f"  Size: {employment.size}")
print(f"  Workers: {employment.source_ids[: employment.size]}")
print(f"  Employers: {employment.target_ids[: employment.size]}")
print(f"  Wages: {employment.wage[: employment.size]}")
After adding records:
  Size: 5
  Workers: [0 1 2 3 0]
  Employers: [2 2 0 1 1]
  Wages: [50. 55. 60. 45. 52.]
Querying Relationships#
Use query methods to find edges for specific agents.
# Find all records for worker 0
worker_0_edges = employment.query_sources(0)
print("\nWorker 0 employment records:")
print(f"  Edge indices: {worker_0_edges}")
print(f"  Employers: {employment.target_ids[worker_0_edges]}")
print(f"  Wages: {employment.wage[worker_0_edges]}")

# Find all records for employer 2
employer_2_edges = employment.query_targets(2)
print("\nEmployer 2 records:")
print(f"  Edge indices: {employer_2_edges}")
print(f"  Workers: {employment.source_ids[employer_2_edges]}")
print(f"  Wages: {employment.wage[employer_2_edges]}")
Worker 0 employment records:
  Edge indices: [0 4]
  Employers: [2 1]
  Wages: [50. 52.]

Employer 2 records:
  Edge indices: [0 1]
  Workers: [0 1]
  Wages: [50. 55.]
Aggregating Relationship Data#
Aggregate edge data by source or target.
# Create a denser relationship for aggregation demo
n_workers = 10
n_employers = 3
n_edges = 15

# Random employment network
rng = bam.make_rng(42)
demo_emp = EmploymentHistory(
    source_ids=np.full(50, -1, dtype=np.intp),
    target_ids=np.full(50, -1, dtype=np.intp),
    size=0,
    capacity=50,
    wage=np.zeros(50, dtype=np.float64),
    start_wage=np.zeros(50, dtype=np.float64),
    performance_score=np.zeros(50, dtype=np.float64),
    start_period=np.zeros(50, dtype=np.int64),
    duration=np.zeros(50, dtype=np.int64),
    is_active=np.zeros(50, dtype=np.bool_),
    was_fired=np.zeros(50, dtype=np.bool_),
)

# Add random edges
for i in range(n_edges):
    demo_emp.source_ids[i] = rng.integers(0, n_workers)
    demo_emp.target_ids[i] = rng.integers(0, n_employers)
    demo_emp.wage[i] = rng.uniform(40, 80)
    demo_emp.is_active[i] = True
demo_emp.size = n_edges

print(f"\nDemo employment network: {demo_emp.size} edges")
print(f"  Workers: 0-{n_workers - 1}")
print(f"  Employers: 0-{n_employers - 1}")

# Aggregate total wages by employer
wages_by_employer = demo_emp.aggregate_by_target(
    demo_emp.wage, func="sum", n_targets=n_employers
)
print("\nTotal wages by employer:")
for i, w in enumerate(wages_by_employer):
    print(f"  Employer {i}: {w:.2f}")

# Count workers per employer
workers_per_employer = demo_emp.aggregate_by_target(
    demo_emp.wage,
    func="count",
    n_targets=n_employers,  # Any array works for count
)
print(f"\nWorkers per employer: {workers_per_employer.astype(int)}")

# Average wage per employer
avg_wage_by_employer = demo_emp.aggregate_by_target(
    demo_emp.wage, func="mean", n_targets=n_employers
)
print("\nAverage wage by employer:")
for i, w in enumerate(avg_wage_by_employer):
    print(f"  Employer {i}: {w:.2f}")
Demo employment network: 15 edges
  Workers: 0-9
  Employers: 0-2

Total wages by employer:
  Employer 0: 204.36
  Employer 1: 283.38
  Employer 2: 439.85

Workers per employer: [3 5 7]

Average wage by employer:
  Employer 0: 68.12
  Employer 1: 56.68
  Employer 2: 62.84
Removing Edges#
Remove edges using masks or ID lists.
# Remove edges for a specific employer (layoffs)
print(f"\nBefore layoffs: {demo_emp.size} edges")

# Method 1: Using purge_targets
# removed = demo_emp.purge_targets(np.array([1]))  # Remove all for employer 1

# Method 2: Using drop_rows with custom mask
layoff_mask = np.zeros(demo_emp.size, dtype=bool)
layoff_mask[: demo_emp.size] = demo_emp.target_ids[: demo_emp.size] == 1
n_removed = demo_emp.drop_rows(layoff_mask)

print(f"After layoffs: {demo_emp.size} edges")
print(f"Removed: {n_removed} employment records")
Before layoffs: 15 edges
/home/docs/checkouts/readthedocs.org/user_builds/bam-engine/checkouts/stable/examples/advanced/example_custom_relationships.py:322: UserWarning: EmploymentHistory.drop_rows() was not overridden but has extra edge arrays ['name', 'source_role', 'target_role', 'cardinality', 'wage', 'start_wage', 'performance_score', 'start_period', 'duration', 'is_active', 'was_fired'] that were not compacted. Override drop_rows() to compact these arrays.
  n_removed = demo_emp.drop_rows(layoff_mask)
After layoffs: 10 edges
Removed: 5 employment records
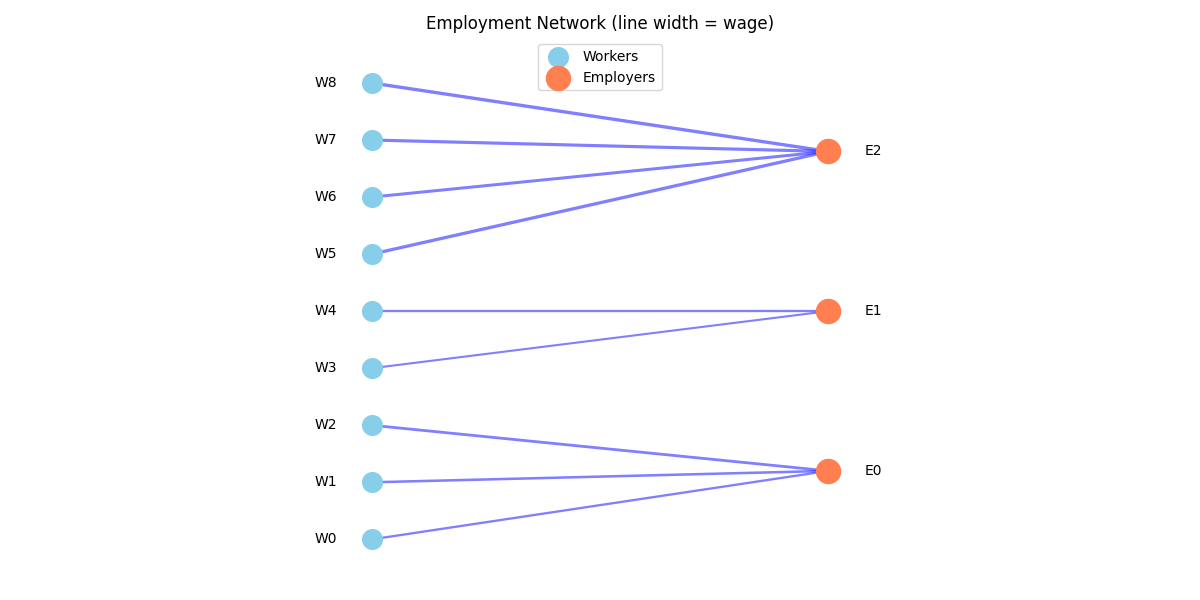
Visualizing Relationship Networks#
Plot the relationship structure as a network.
import matplotlib.pyplot as plt

# Create fresh network for visualization
viz_emp = EmploymentHistory(
    source_ids=np.full(30, -1, dtype=np.intp),
    target_ids=np.full(30, -1, dtype=np.intp),
    size=0,
    capacity=30,
    wage=np.zeros(30, dtype=np.float64),
    start_wage=np.zeros(30, dtype=np.float64),
    performance_score=np.zeros(30, dtype=np.float64),
    start_period=np.zeros(30, dtype=np.int64),
    duration=np.zeros(30, dtype=np.int64),
    is_active=np.zeros(30, dtype=np.bool_),
    was_fired=np.zeros(30, dtype=np.bool_),
)

# Add edges
edges = [
    (0, 0, 50),
    (1, 0, 55),
    (2, 0, 60),  # Workers at employer 0
    (3, 1, 45),
    (4, 1, 50),  # Workers at employer 1
    (5, 2, 70),
    (6, 2, 65),
    (7, 2, 68),
    (8, 2, 72),  # Workers at employer 2
]
for w, e, wage in edges:
    idx = viz_emp.size
    viz_emp.source_ids[idx] = w
    viz_emp.target_ids[idx] = e
    viz_emp.wage[idx] = wage
    viz_emp.size += 1

# Simple bipartite visualization
fig, ax = plt.subplots(figsize=(12, 6))

n_workers_viz = 9
n_employers_viz = 3

# Position nodes
worker_x = np.zeros(n_workers_viz)
worker_y = np.linspace(0, 1, n_workers_viz)
employer_x = np.ones(n_employers_viz)
employer_y = np.linspace(0.15, 0.85, n_employers_viz)

# Draw edges
for i in range(viz_emp.size):
    w = viz_emp.source_ids[i]
    e = viz_emp.target_ids[i]
    wage = viz_emp.wage[i]
    ax.plot(
        [worker_x[w], employer_x[e]],
        [worker_y[w], employer_y[e]],
        "b-",
        alpha=0.5,
        linewidth=wage / 30,
    )

# Draw nodes
ax.scatter(worker_x, worker_y, s=200, c="skyblue", zorder=5, label="Workers")
ax.scatter(employer_x, employer_y, s=300, c="coral", zorder=5, label="Employers")

# Labels
for i in range(n_workers_viz):
    ax.annotate(f"W{i}", (worker_x[i] - 0.1, worker_y[i]), ha="center", va="center")
for i in range(n_employers_viz):
    ax.annotate(f"E{i}", (employer_x[i] + 0.1, employer_y[i]), ha="center", va="center")

ax.set_xlim(-0.3, 1.3)
ax.set_ylim(-0.1, 1.1)
ax.set_aspect("equal")
ax.legend(loc="upper center")
ax.set_title("Employment Network (line width = wage)")
ax.axis("off")
plt.tight_layout()
plt.show()
Working with the Built-in LoanBook#
The LoanBook relationship demonstrates advanced features.
# Fresh simulation for loan analysis
# Run longer to ensure loans are generated
sim = bam.Simulation.init(n_firms=100, n_households=500, seed=42)
sim.run(n_periods=50)

loans = sim.get_relationship("LoanBook")

print("\nLoanBook after 50 periods:")
print(f"  Active loans: {loans.size}")

if loans.size > 0:
    # Aggregate debt by borrower
    debt_per_firm = loans.aggregate_by_source(
        loans.debt, func="sum", n_sources=sim.n_firms
    )

    # Aggregate loans by lender
    loans_per_bank = loans.aggregate_by_target(
        loans.debt, func="count", n_targets=sim.n_banks
    )

    print("\n  Debt statistics:")
    print(f"    Total debt: {ops.sum(debt_per_firm):.2f}")
    print(f"    Mean debt per firm: {ops.mean(debt_per_firm):.2f}")
    print(f"    Firms with debt: {ops.sum(ops.greater(debt_per_firm, 0))}")

    print(f"\n  Loans per bank: {loans_per_bank.astype(int)}")

    # Plot debt distribution
    fig, axes = plt.subplots(1, 2, figsize=(12, 4))

    # Debt distribution
    ax1 = axes[0]
    ax1.hist(debt_per_firm[debt_per_firm > 0], bins=20, edgecolor="black")
    ax1.set_xlabel("Debt per Firm")
    ax1.set_ylabel("Count")
    ax1.set_title("Debt Distribution (firms with debt)")

    # Loans per bank
    ax2 = axes[1]
    ax2.bar(range(sim.n_banks), loans_per_bank)
    ax2.set_xlabel("Bank ID")
    ax2.set_ylabel("Number of Loans")
    ax2.set_title("Loan Portfolio Size by Bank")

    plt.tight_layout()
    plt.show()
else:
    print(
        "  No active loans to visualize. This can happen when firms don't need credit."
    )
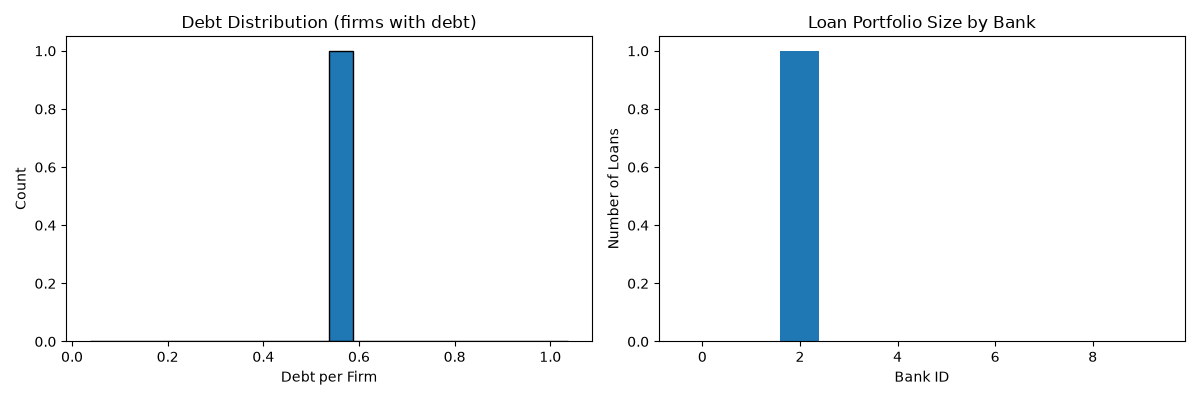
LoanBook after 50 periods:
  Active loans: 1

  Debt statistics:
    Total debt: 0.54
    Mean debt per firm: 0.01
    Firms with debt: 1.0

  Loans per bank: [0 0 1 0 0 0 0 0 0 0]
Key Takeaways#
Relationships connect agents from different (or same) roles
Use
@relationshipdecorator with source and target rolesCOO sparse format: source_ids, target_ids, plus edge data arrays
Query with
query_sources(),query_targets()Aggregate with
aggregate_by_source(),aggregate_by_target()Remove edges with
drop_rows()orpurge_sources()/purge_targets()Built-in LoanBook demonstrates advanced relationship patterns
Total running time of the script: (0 minutes 1.002 seconds)